Summary
Robotic Surgical learning curves can be modeled using data generated during each procedure by grouping Surgeon’s into cohorts by Surgical Specialty, and comparing the groups average procedure duration across cases. These models have many potential applications and can be highly useful in providing benchmarks used to assess surgical efficiency and proficiency. Furthermore, these models can be utilized to drive internal business decisions focused around surgeon training programs and products. Finally, learning curves can provide a basis to quantify the impact that existing training can have on surgical expertise and learning.
Introduction
Learning curves are models that describe the expected change in a variable (referred to as the ‘outcome measure’), by another variable that is selected as a proxy for experience. Figure 1 represents the Average Procedure Duration (outcome measure), for a group of surgeons, by their respective case number (proxy for experience).

In this example, the surgeons in each cohort perform the same procedure subject (Cholecystectomy) and are grouped into a cohort based on their case number.
- The size of the cohort decreases over time, as represented by the size of the points in the chart, because fewer surgeons perform a high number of cases.
- The y-axis represents average procedure duration for the group of surgeons, while the x-axis shows the case volume that the group has reached.
Support for Utilizing Learning Curves
Based on widespread review of available academic literature conducted in this effort, as well as extensive internal analysis, there is strong support and consensus for utilizing learning curves to achieve objectives in the following high-level categories:
- Driving internal business decisions focused around surgeon training programs and products; learning curves can provide a basis to quantify the impact that existing training can have on surgical expertise and learning.
- Providing learning curve knowledge back to our surgeons and hospitals in the form of structured and validated insights to empower their own individual decision-making associated with their personal learning, knowledge gathering, proficiency, and overall execution of a surgical procedure.
Potential Applications
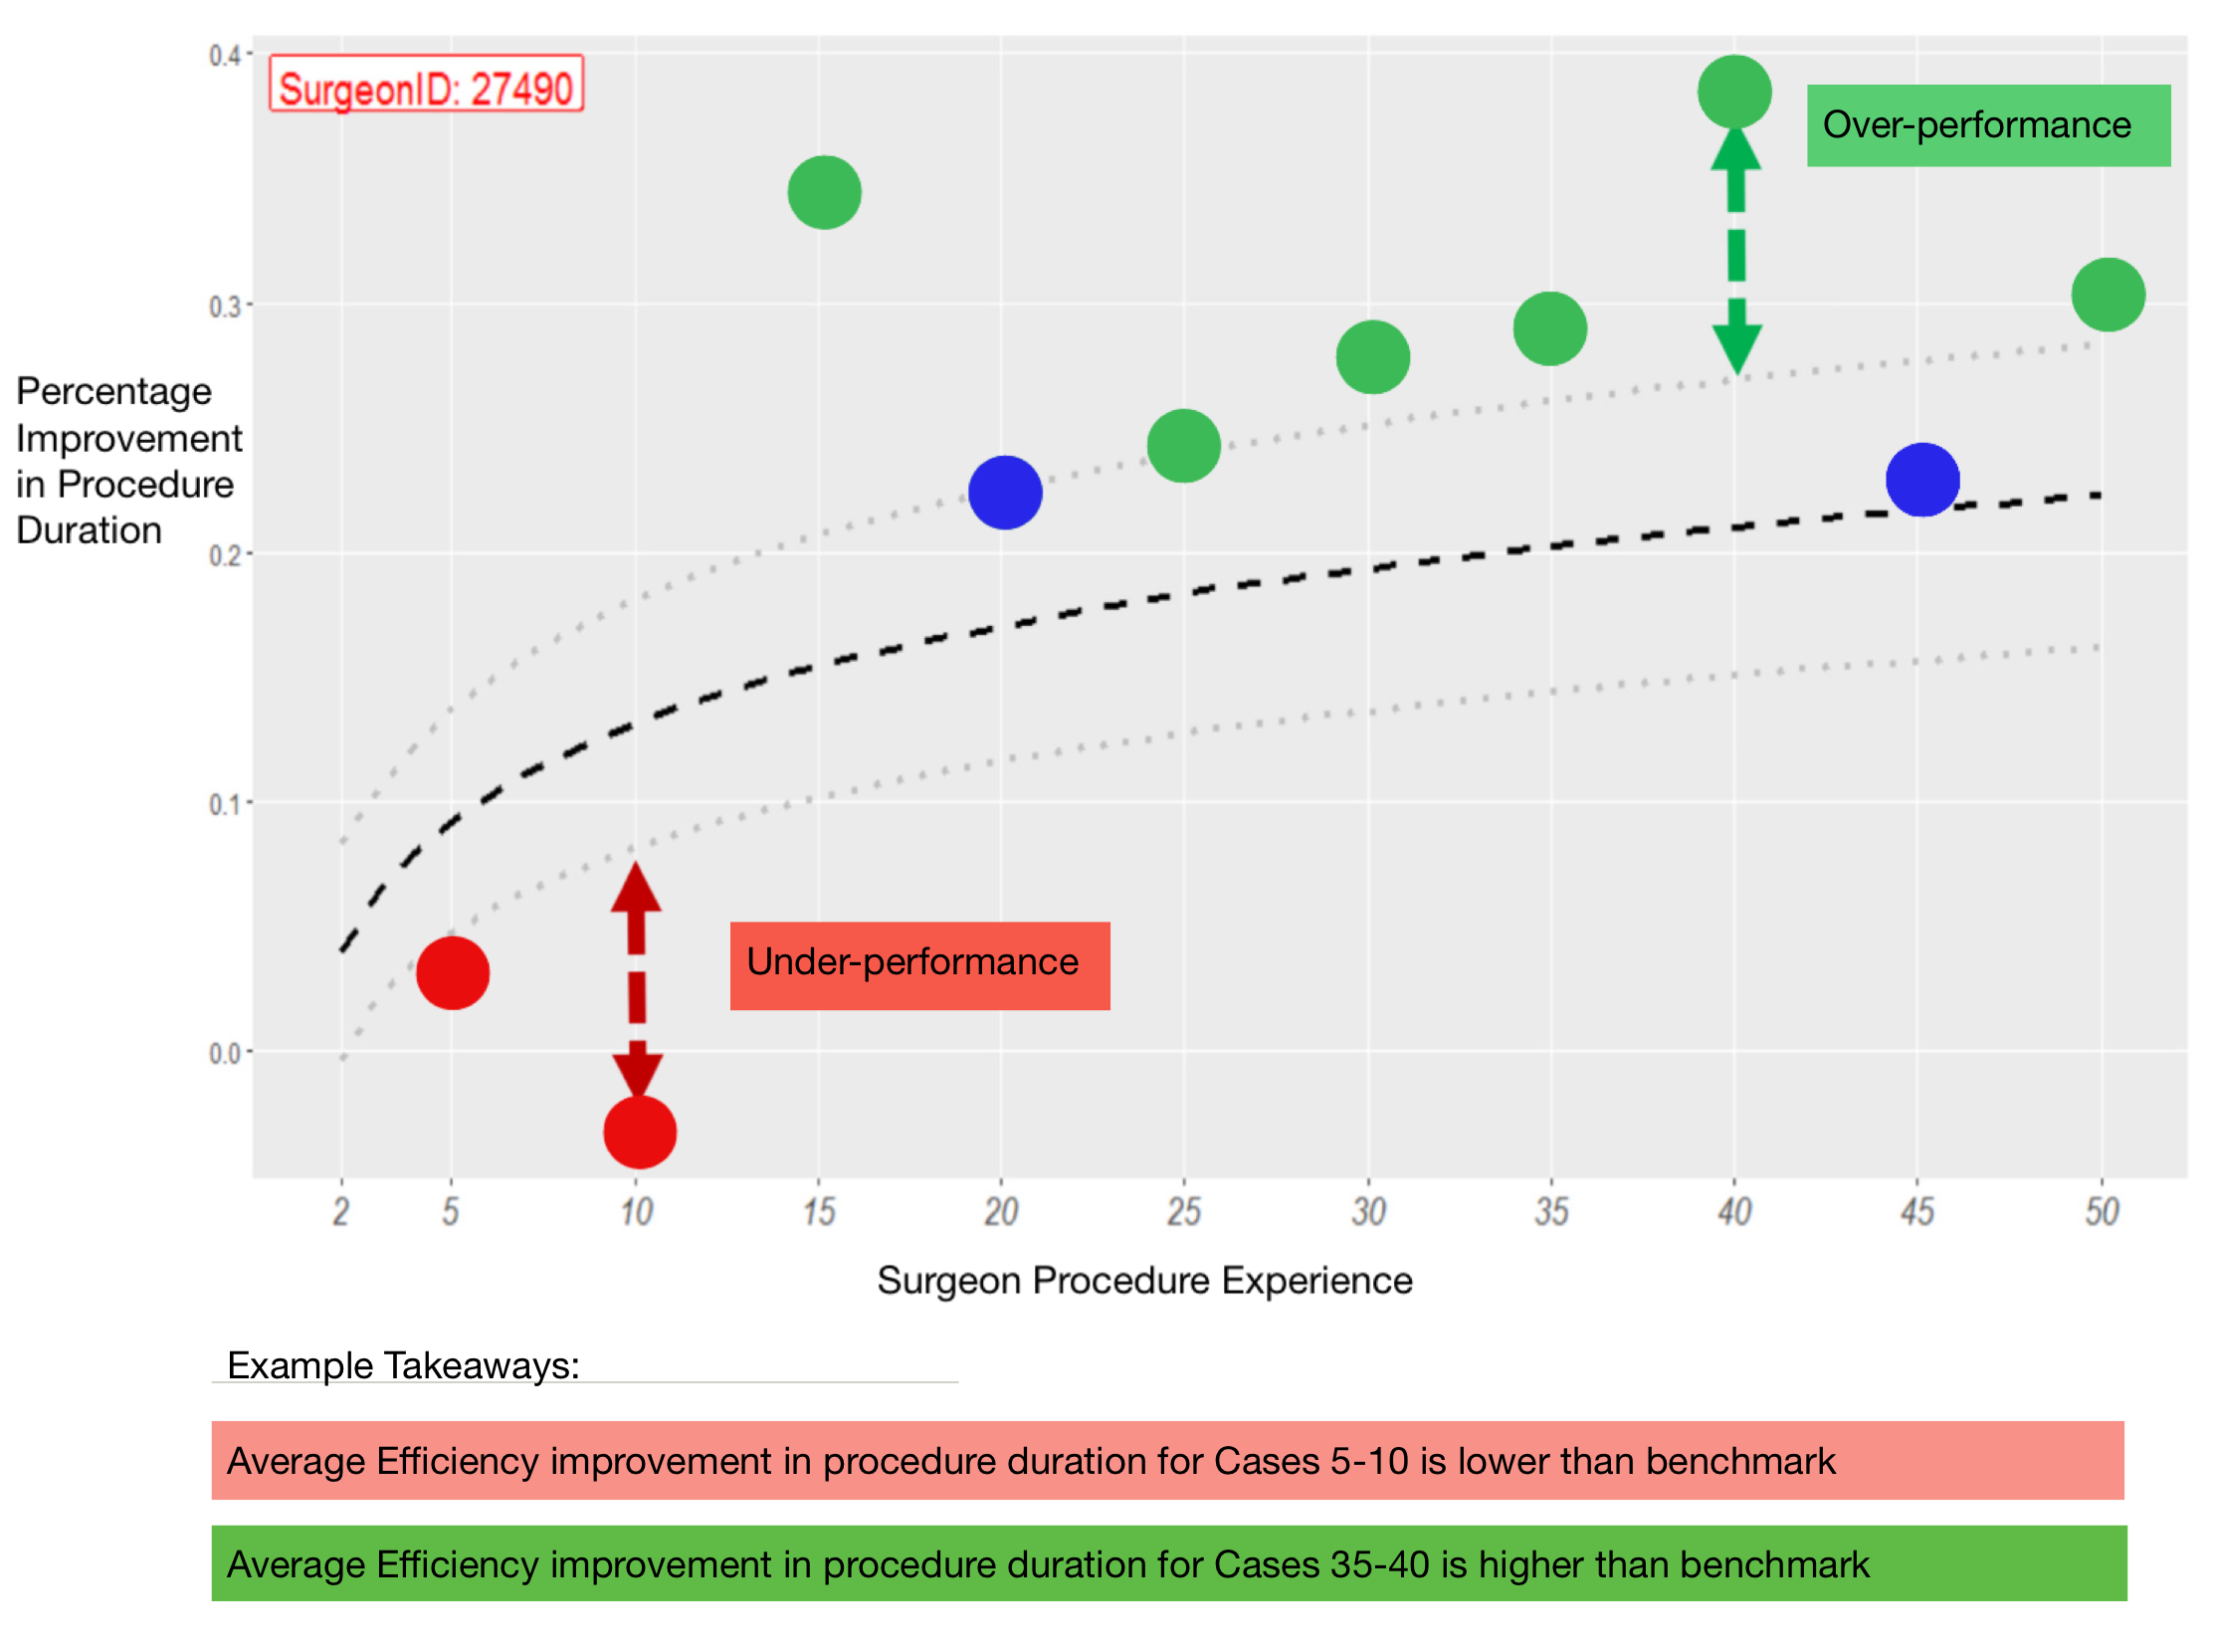
Due to the variability at the individual surgeon level, learning models by cohort provides us a more robust benchmark that can be used for individual performance monitoring (e.g. an individual surgeon can know their performance relative to similar surgeons) and enables comparison across groups (e.g. experienced surgeons vs. less experienced surgeons who perform the same procedure). The following figure demonstrates an example case where the learning curve in Figure 1 was transformed to represent expected efficiency, and then a selected surgeon’s data was benchmarked against the cohort. This is seen in Figure 2 below.
These important comparisons can lead to insights that answer questions such as:
- Does surgeon training impact a given outcome measure? Which programs have most impact (e.g. accelerates learning the fastest)?
- Does procedure velocity (frequency of surgery) impact surgeon learning? If so, what is the quantified impact to procedure efficiency measures? What is the optimal frequency of procedures to perform for each type of procedure?
- How do we help Surgeons effectively pivot from less complex procedures (hernia) to more complex procedures?
Additional Findings
Preliminary models across a range of different surgical procedures guides our understanding that the rate of learning, using procedure duration as the outcome measure1, varies by subject, while other attributes such as the hospital environment, the surgical instruments utilized, etc. shift the curve upwards or downwards.
This suggests that we can quantify the relative complexity of procedure types (Figure 3) and rely on other attributes to improve usage of the curve as a potential benchmark.

Insights from Figure 3
- Figure 3 illustrates the difference in the learning patterns across procedure subjects when controlling for other attributes (such as the size or type of the hospital site).
- We can see from this preliminary assessment that Prostatectomies and Hysterectomies seems to reflect a similar rate of learning in procedure duration. However, a Hysterectomy takes longer to complete on average (as seen by the absolute level depicted in the chart), while Myomectomies have both a faster learning curve (easier in complexity) and takes less time to complete.
These initial models were found to be statistically significant and serve as the best evidence that additional effort would produce high impact value to many stakeholders.
Footnotes
Rate of learning can be described as: the decrease in an outcome being measured, over each subsequent case, time, or other measure of experience↩︎